Workflow cloud 04 · Portfolio Management
Know which practices are moving your numbers, and why.
For ACO leaders and the teams who manage and grow the network.
An ACO earns shared savings when spending comes in under its benchmark. Kairon Health shows which practices’ cost is growing faster than the national trend, why your cost per patient moved and which practices to recruit next.
Illustrative screens, on fictional data.
What changes
What changes when the numbers move
The ACO report says spending rose. Nobody can say which practices drove it.
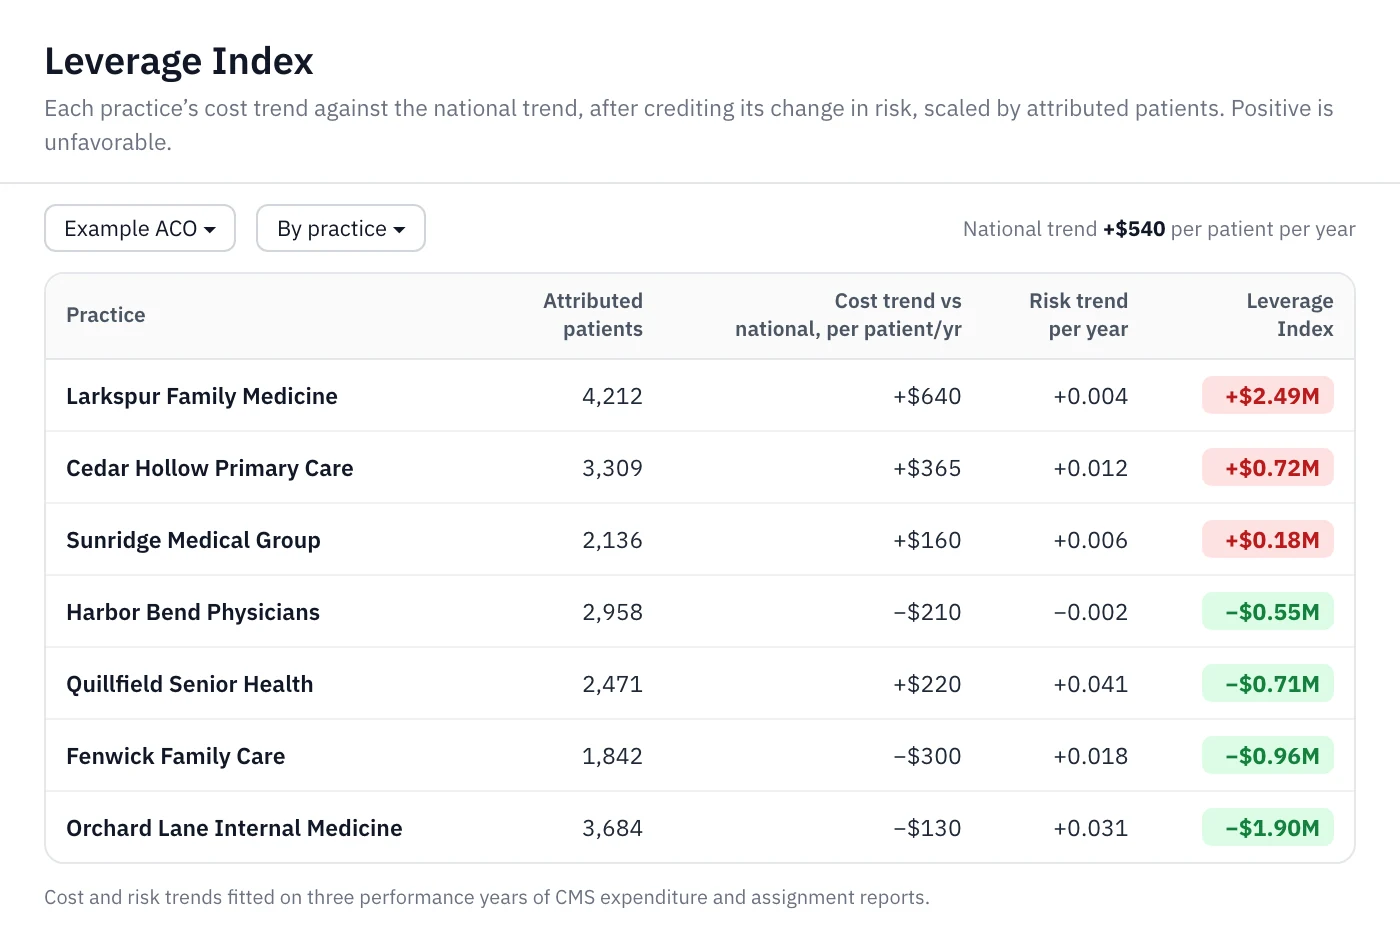
Each practice’s cost trend is compared with the national trend, after crediting its change in risk, and scaled by its attributed patients.
Cost per patient went up, and nobody can say whether new patients, departures or the patients who stayed moved it.
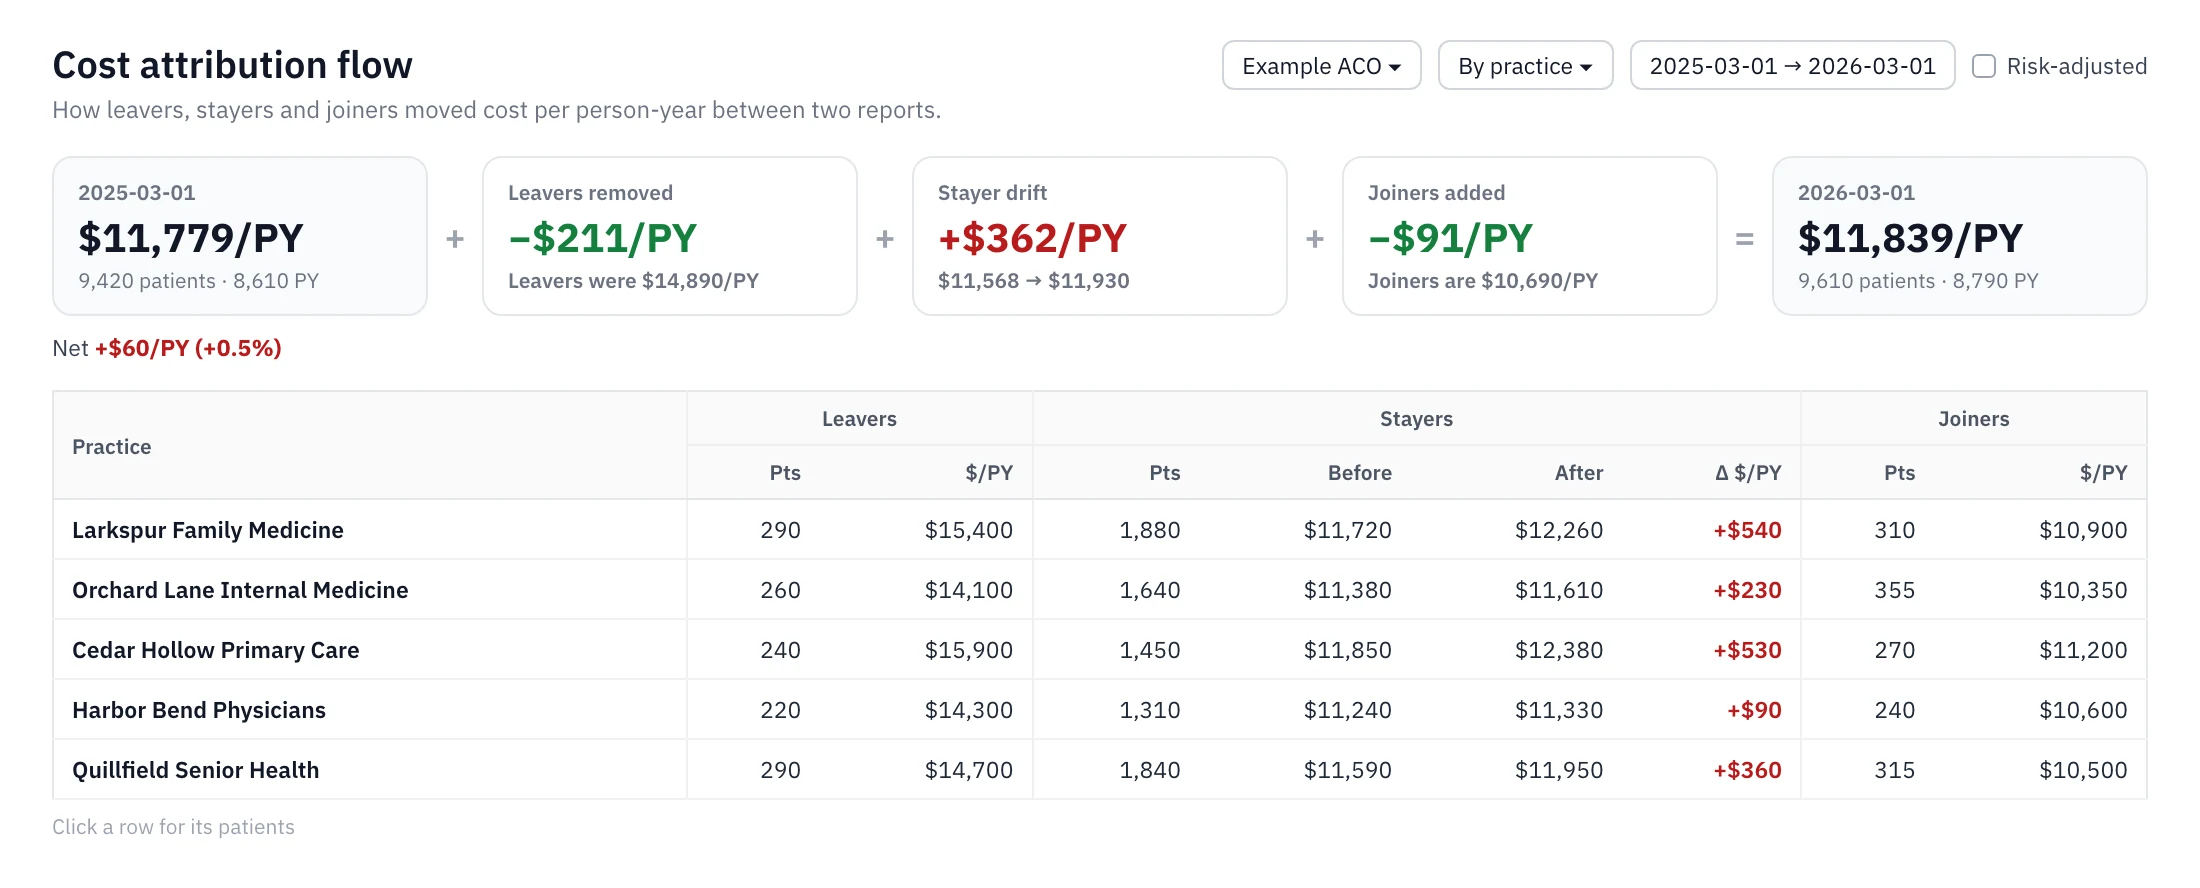
Kairon splits the change into leavers, joiners and the patients who stayed, and the three add up to the change exactly.
Preparing for a recruiting meeting means days of pulling public files.
Each target has a conversation guide with its ACO history, how the practice has changed and where your services fit, ready to download as a PDF.
How it works
Four questions, in order
Is our cost trend beating the national trend?
See which practices’ cost is growing faster than the national trend, after crediting their change in risk.
Which practices are moving your numbers?
Weigh each practice’s trend by its attributed patients, then see whose patients got more expensive and whose panel changed.
Why did cost move?
Last report’s cost per person-year, minus leavers, plus the change among patients who stayed, plus joiners, equals this report’s.
Who should we add next?
Find targets in your territory, read each practice’s conversation guide and follow every prospect in pipeline reports.
Illustrative screens, on fictional data.
What’s inside
What your network team gets
Leverage Index
Each practice’s cost trend against the national trend, after crediting its change in risk, scaled by its attributed patients. Built from your CMS quarterly expenditure and assignment reports.
Cost attribution
A change in cost per person-year split into leavers, joiners and the patients who stayed, by practice, facility or provider, risk-adjusted if you choose. Click a practice for the patients behind it.
Attribution health
See who stayed, who is new or returning, and why each patient left, whether they died, moved to another of your providers, went to a competitor or stopped coming in. Plus the patients your clinicians see who are attributed to another practice.
Network growth
Targets in your territory, largest Medicare panels first, each with a conversation guide covering where your services fit. Salesforce matching is switched on when you ask, and pipeline reports score each prospect from its conversations.
Built for
Who makes the network call
ACO Leadership
Decide where to focus and who to recruit with the same evidence your team sees.
Finance and Analytics
Explain a cost change by who joined, who left and who stayed, down to the patient.
Network Development
Start every outreach with the practice’s conversation guide, not a cold list.
Where this sits
- Fed by your data Your data is messy. Our platform doesn’t care.
- Portfolio ManagementPractice cost trends, cost attribution and network growth
- Measured in Impact Analytics Studies test whether this work moved the number, while you can still change course.
Bring your market.
With LEAD replacing REACH in 2027, network composition is on the table for many ACOs this fall. Tell us which practices you’re weighing or worried about, and we’ll walk you through how Kairon reads them.